Skip to content
Algebra · Mathematics

Quadratic Graphs Simulation: Vertex Form Step by Step

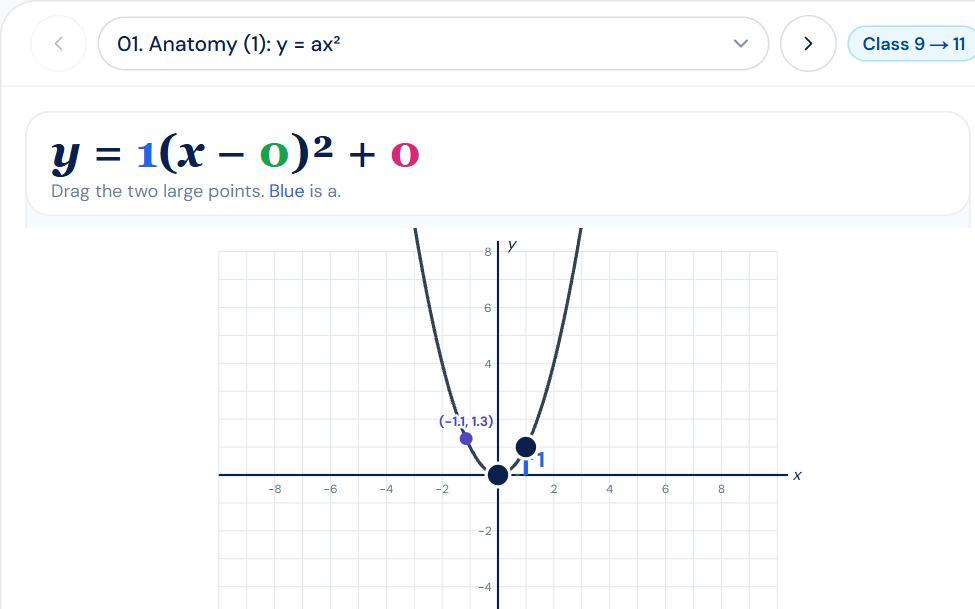
The parabola y = a(x − h)² + k taken apart and put back together, step by step, after GeoGebra's quadratic “anatomy” apps: drag the two large points — the vertex and the point one step to its right — and the equation, coloured like its arrows (green h, pink k, blue a), follows. Then sketch four functions and CHECK each, name a drawn parabola in three checked steps, complete the square one line at a time while the graph waits for its vertex, and read roots, the discriminant and the sign of a quadratic straight off the curve.

Interactive virtual lab · no download · works on phones and laptops

Chapter
Quadratic Equations
For
Class 9–12 · JEE Main · JEE Advanced
Time
~35 min

Quadratic Graphs Step-by-Step Lab is a Pro simulation

Pro opens all 159 virtual labs — 745 simulations with guides and quizzes.

How to use it

  1. 1Pick a module from the list (7, in three groups); set your level at the top right.
  2. 2Drag the two large points on the grid; in the drills press CHECK until it says CORRECT, then Next question.
  3. 3Use Predict before you look, then Derive, Questions, Practise and Compare.

What to notice

  • From the vertex, one step right the curve rises by exactly ; two steps, — the steps are
  • is zero at : the vertex is , and means , a shift to the LEFT.
  • ; the vertex is .
  • For the discriminant is : two roots when and have opposite signs.
  • Between the roots the sign is opposite to , outside them the same as .

For teachers

A ready-made teaching kit comes with this lab

  • Lesson plan

    35 min, 4 steps

  • Ask the class

    4 questions with answers

  • Quick quiz

    7 questions, printable

  • Key formulas

    4 formulas

About the Quadratic Graphs Step-by-Step Lab simulation

The Quadratic Graphs Step-by-Step Lab takes the parabola y = a(x − h)² + k apart the way the well-known GeoGebra “anatomy” apps do, and then drills it. You drag two large points: the vertex, and the point one step to its right. The equation above the grid is coloured like the arrows on it — a green arrow h along the x-axis to the vertex, a pink arrow k up to it, and a blue arrow a for the rise one step to the right — so each number in the equation is visibly a distance on the graph. It starts with y = ax², adds k, then h, and shows the 1a, 3a, 5a staircase that makes the curve.

Then come the drills, each checked step by step: sketch four given functions by placing the two points and pressing CHECK (a wrong check names the part to fix, usually the sign of h); name an orange parabola by putting a point on its vertex, a point one step right, then picking its equation; complete the square for y = ax² + bx + c one line at a time while the graph waits for its vertex; and read the roots, the discriminant D = −4ak and the sign of the quadratic straight from the curve, with the x-axis coloured green where y > 0 and red where y < 0, to solve quadratic inequalities. A dot runs along every curve by itself with its coordinates.

Also covers: quadratic functions, graph of quadratic function, parabola graph, vertex form, y = a(x - h)^2 + k, transformations of quadratic functions, transforming graphs of quadratic functions, anatomy of a parabola, vertex of a parabola, axis of symmetry, sketch a parabola, completing the square, standard form to vertex form, roots of quadratic equation, discriminant, nature of roots, sign of quadratic expression, quadratic inequalities, quadratic equations class 10, quadratic equations class 11, quadratic equations jee.

Frequently asked questions

What do a, h and k do to the graph of y = a(x − h)² + k?

h moves the parabola left or right so that its vertex is at x = h, k moves it up or down to height k, and a sets the shape: from the vertex, one step to the right the curve rises by a. A large |a| makes a narrow parabola, a small |a| a wide one, and a negative a turns it upside down.

Why does (x − 3) move the graph to the right?

The bracket (x − 3)² is zero, and the parabola at its lowest (or highest) point, when x = 3. So the vertex sits at x = 3, to the right of the origin. The sign inside the bracket is the opposite of the direction of the shift: (x + 3) puts the vertex at x = −3.

How do you find the vertex of y = ax² + bx + c?

Complete the square: take a out of the x terms, add and subtract the square of half the x coefficient, close the square and tidy. The result is a(x + b/2a)² + c − b²/4a, so the vertex is at x = −b/2a with height c − b²/4a, which is −D/4a.

How can a graph tell me where a quadratic is positive?

The roots split the x-axis. Between them the parabola is on one side of the axis and outside them on the other: for a > 0 it is negative between the roots and positive outside, for a < 0 the reverse. If there are no real roots (D < 0) the quadratic has the sign of a everywhere.