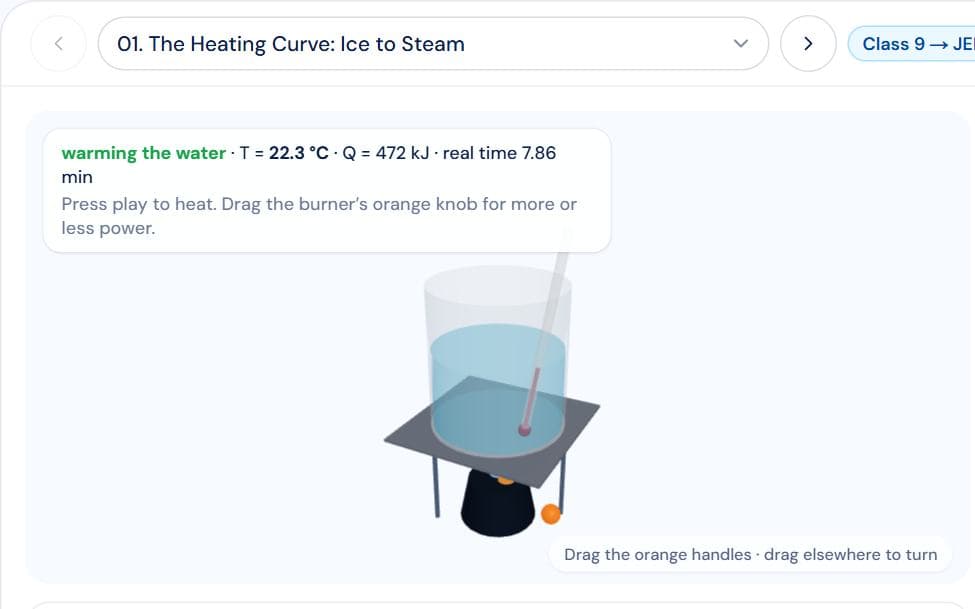
About the Heating Curve of Water simulation
The heating curve of water is the graph of temperature against heat supplied as ice is turned into steam, and reading it is a core skill from Class 9 Matter to Class 11 Thermal Properties of Matter and NEET. In this heating curve simulation a block of ice sits in a beaker on a burner in 3D, with a thermometer in it. Press play: the ice warms, melts at 0 °C, the water warms and boils at 100 °C, and the steam heats — while the graph draws itself, coloured by stage.
The two flat parts are where the heat goes into changing state instead of raising the temperature — the latent heats of fusion (336 kJ/kg) and vaporisation (2260 kJ/kg). Turn on the particles to see why, and compare how long melting and boiling take on the same burner. The slopes of the sloping parts give the specific heats: ice and steam warm about twice as fast as water. Put a second beaker with more ice on an identical burner and race them.
The last module is the calorimetry question JEE and NEET ask: drop ice into warm water and find the final temperature — after first checking whether the water has enough heat to melt all the ice.
Also covers: heating curve of water, heating curve, ice to steam, temperature vs heat graph, latent heat of fusion, latent heat of vaporisation, melting point, boiling point, phase change, change of state, specific heat of ice, specific heat of water, specific heat of steam, slope of heating curve, why temperature stays constant while boiling, calorimetry, ice and water mixture, mixing ice in water, final temperature of mixture, class 9 matter, class 11 thermal properties.